Video 2 of 7 · 11:14 · Watch in order
Video 2: How to Build a Gantt Chart in AutoCAD
This is the deep walkthrough of the CPMCAD interface itself, the screen where you load your data, run the CPM calculations, and generate a professional Gantt chart directly inside your AutoCAD drawing.
How to build a Gantt chart in AutoCAD
- Point CPMCAD to your Excel workbook. Browse to the file and CPMCAD reads both the Resources sheet and the Initial Schedule sheet, validating column structure, predecessor references, and network logic as it loads.
- Run the CPM calculation. CPMCAD performs a full forward pass for Early Start and Early Finish, then a backward pass for Late Start and Late Finish, and computes Total Float and Free Float for every activity. The critical path, where Total Float equals zero, is identified automatically.
- Review constraint handling. Constraints such as Start No Earlier Than, Finish No Later Than, Must Start On, and Must Finish On are applied during the backward pass, so you can see exactly how a hard deadline reshapes the float in your network.
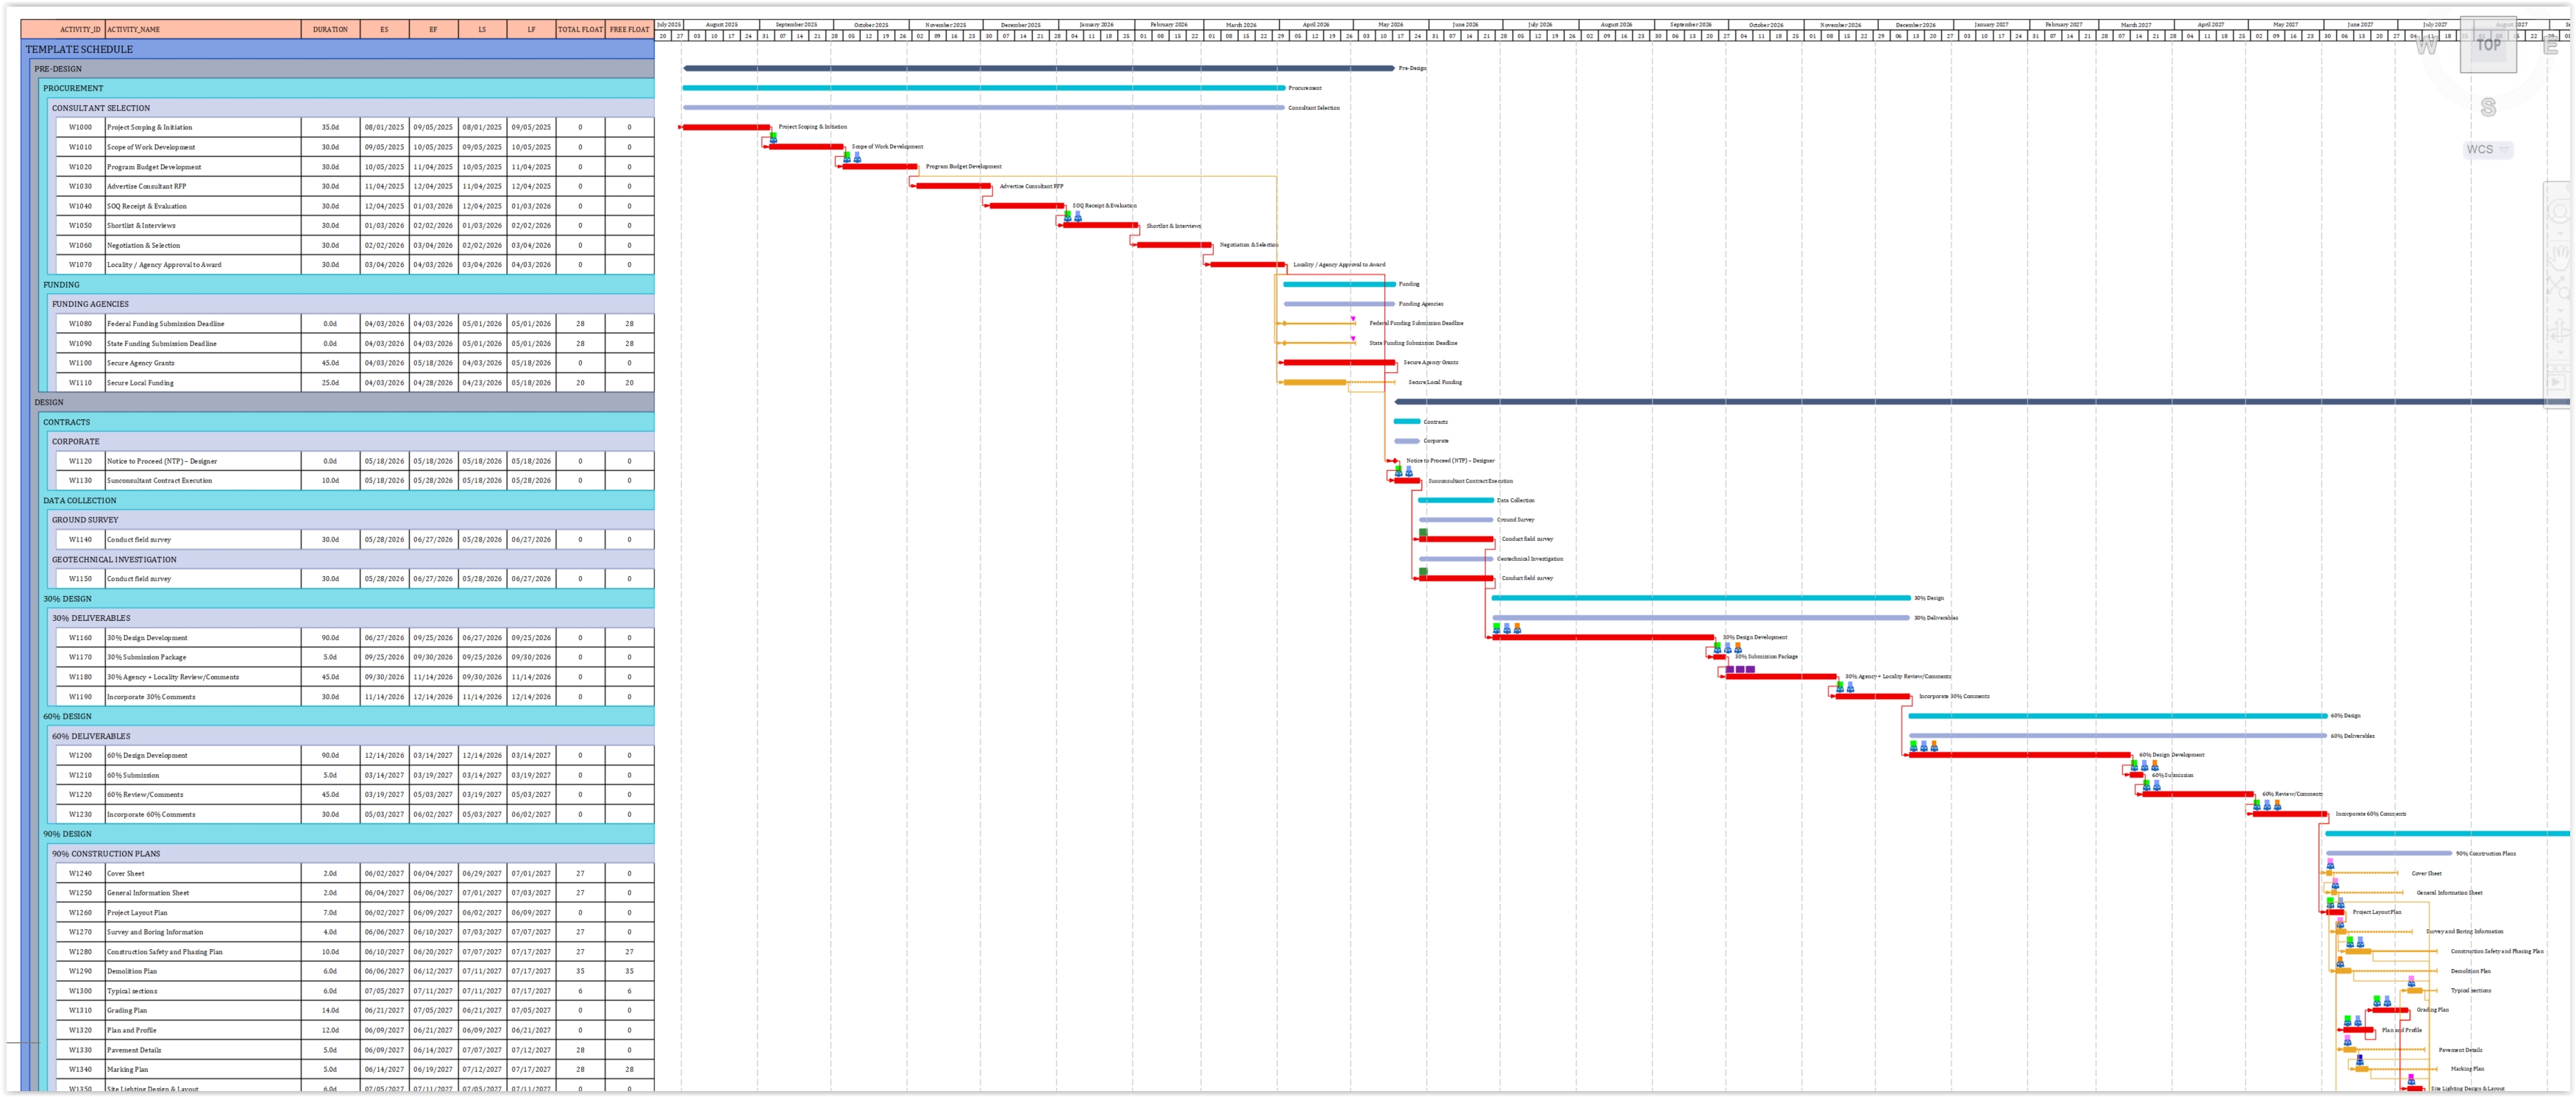
- Generate the Gantt chart. Choose your scale, date range, and which elements to show, activity bars, relationship lines, milestones, float bars, and resource labels, then draw. The chart appears as native AutoCAD geometry in model space.
- Add phase bars, a project bar, and a calendar if needed. Phase bars summarize each major WBS grouping, the project bar gives you one summary line for the whole timeline, and the calendar output plots alongside the Gantt chart for field coordination.
- Export the calculated results back to Excel. Push the computed Early Start, Early Finish, Late Start, Late Finish, Total Float, and Free Float values back into your workbook, so it becomes a complete schedule record.
What you will see in the video
Video overview (from the production script)
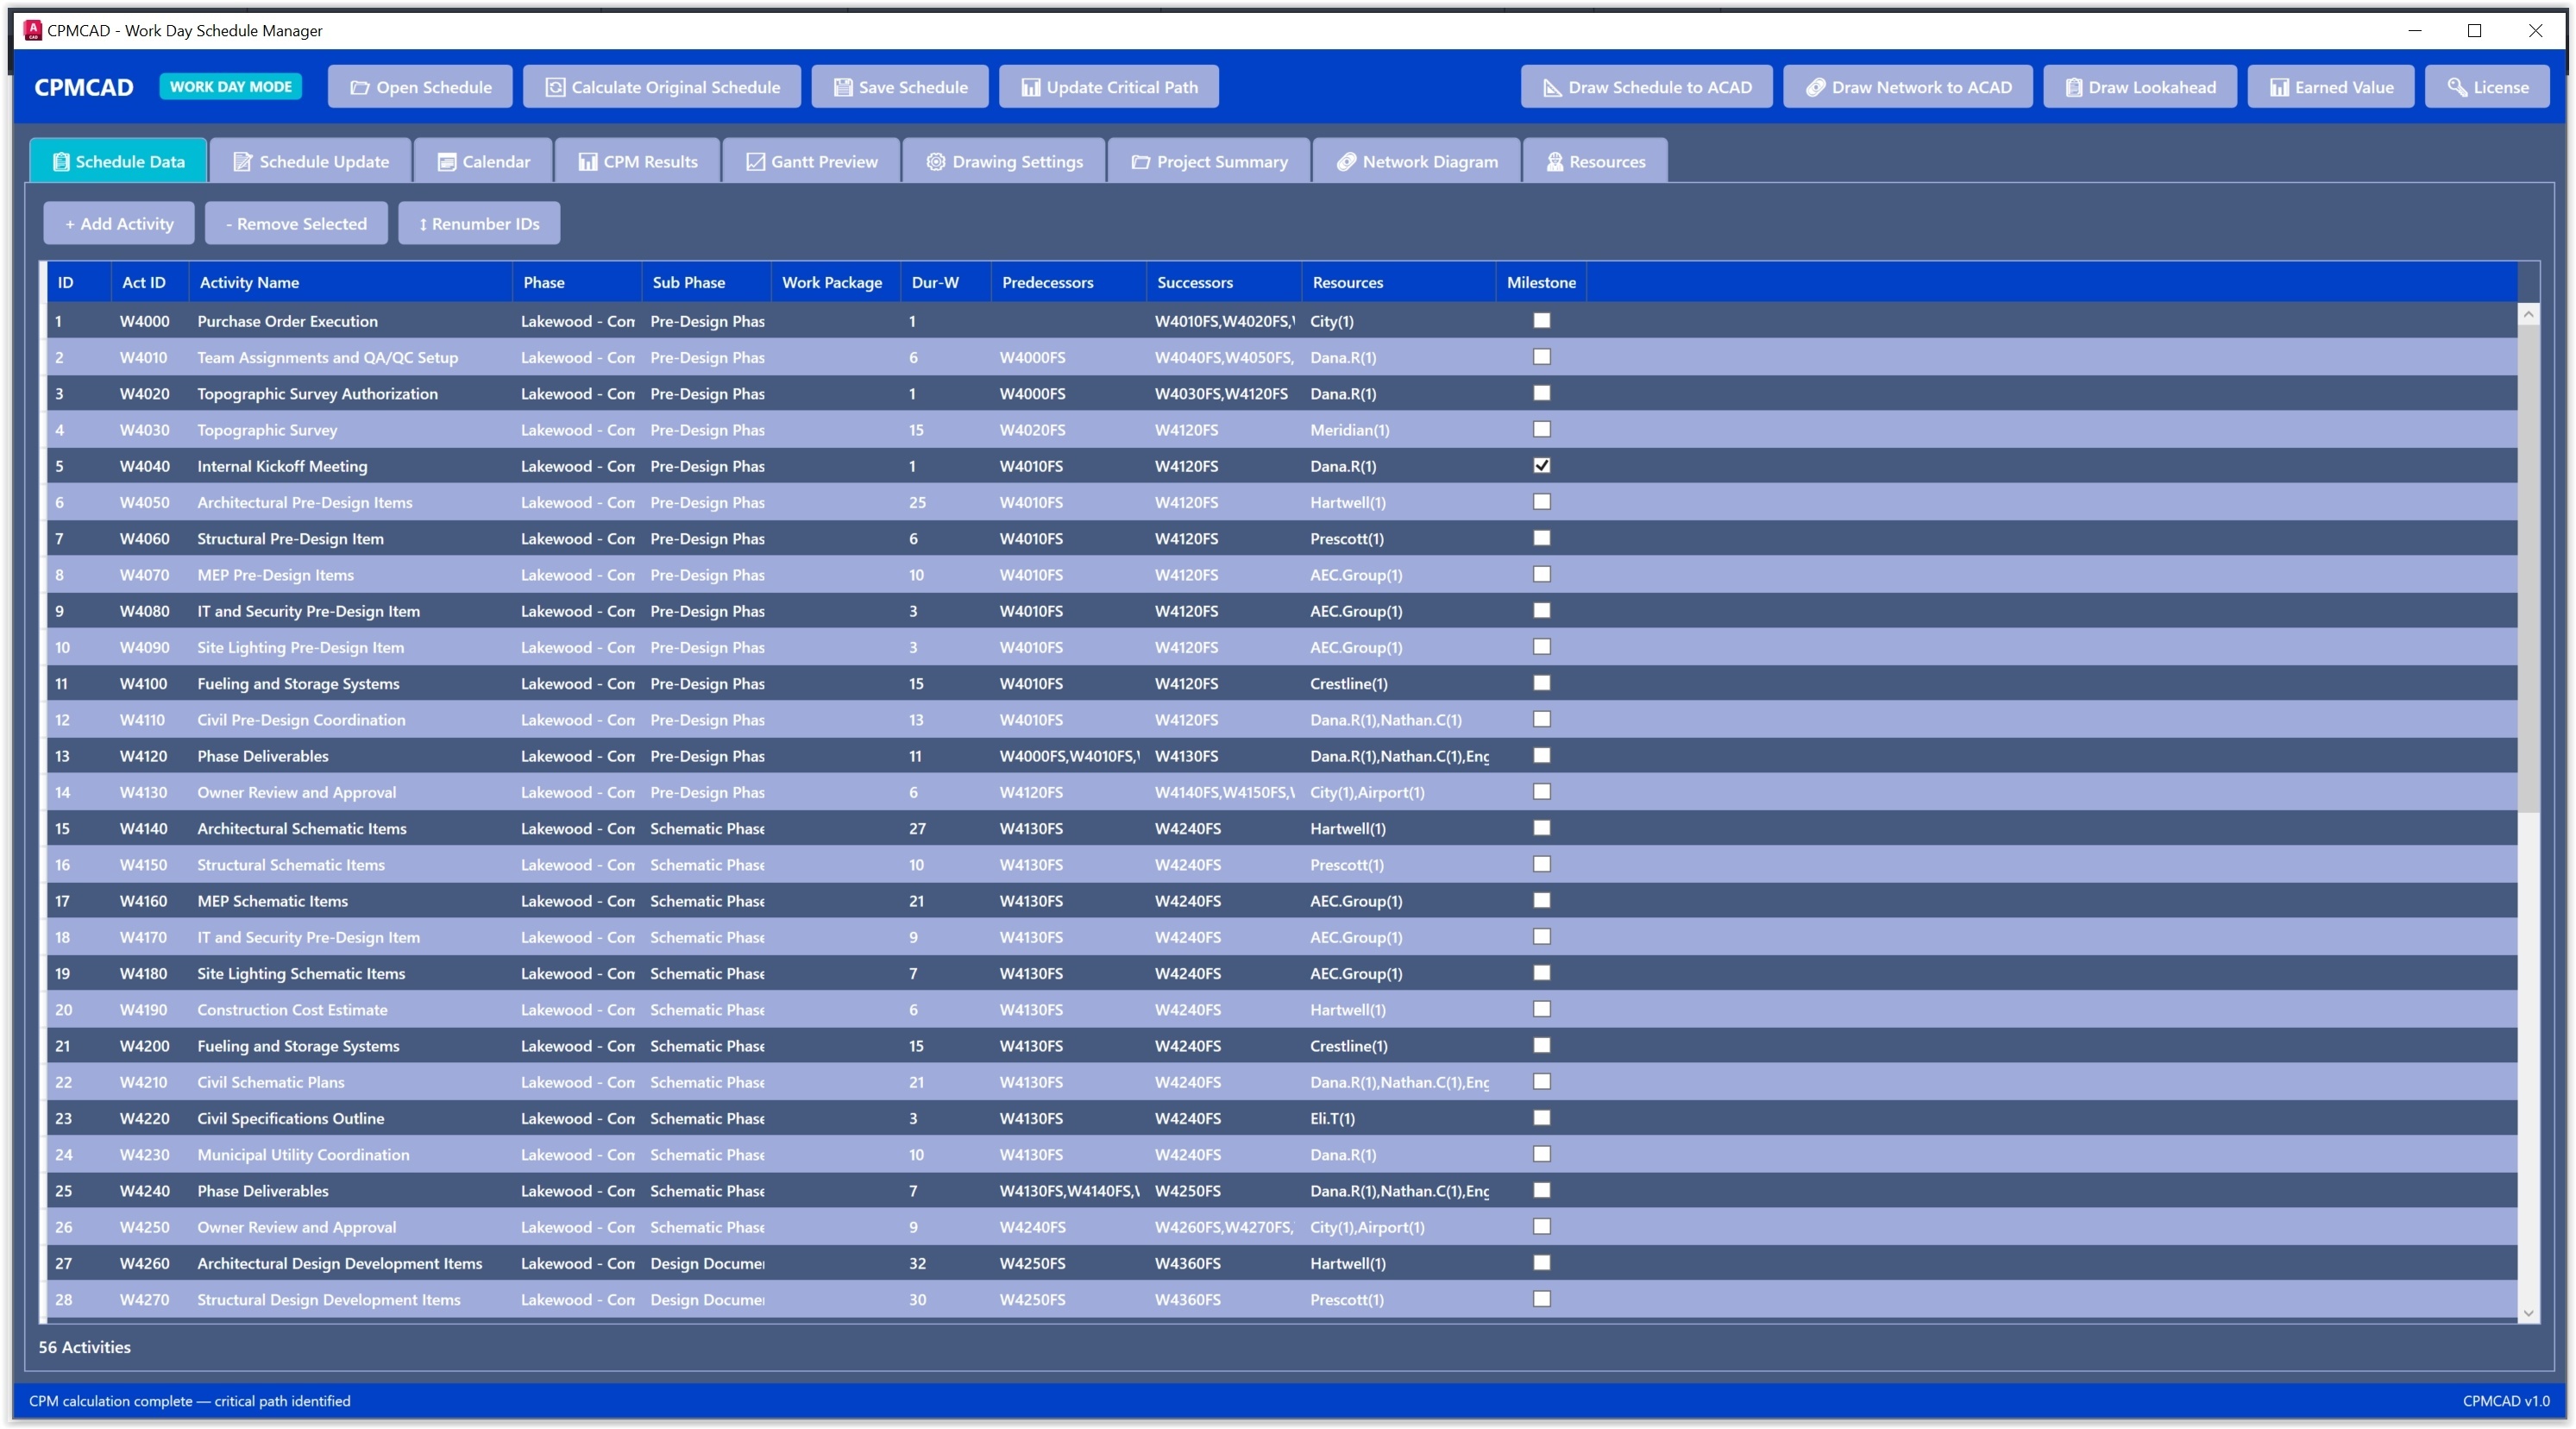
Typing CPMCAD in AutoCAD launches the scheduling interface, the control panel for everything the plugin does. The workflow moves logically: load your data, run calculations, generate output.
The first step is pointing CPMCAD to your Excel workbook. Once selected, CPMCAD reads the Resources sheet and the Initial Schedule sheet and validates the structure, flagging missing columns, invalid predecessor references, or circular logic before you run calculations.
With data loaded, CPMCAD runs the full CPM forward pass, calculating Early Start and Early Finish for every activity, then the backward pass for Late Start and Late Finish. From those two passes it computes Total Float, how much an activity can slip without delaying the project, and Free Float, how much it can slip without affecting its immediate successor. The critical path, where Total Float equals zero, is identified automatically.
CPMCAD supports six schedule constraint types: Start No Earlier Than, Start No Later Than, Finish No Earlier Than, Finish No Later Than, Must Start On, and Must Finish On, all applied through the Excel data and reflected in the calculation.
From there you control what gets drawn: a full Gantt chart with activity bars, phase bars summarizing major WBS groupings, a single project summary bar, and a working day calendar. After CPMCAD runs its calculations, you can export the results back to Excel so your spreadsheet becomes a complete schedule record alongside the CAD output.
Note: this summary is adapted from the production script for this video. Some interface details may have changed since the script was written.
Try it on your own schedule
CPMCAD offers a full-featured 30-day free trial, or $250/year for unlimited use and clean, watermark-free output.